Shojin ryori food pyramid
by permaculture_zone_farming - uploaded on July 18, 2016, 8:16 am
An pie chart made using the data mentioned in upload.wikimedia.org/wikipedia/commons/thumb/e/e0/ModifiedFoodPyramid.JPG/220px-ModifiedFoodPyramid.JPG
See also: en.wikiversity.org/wiki/Extra_info_on_food_consumption
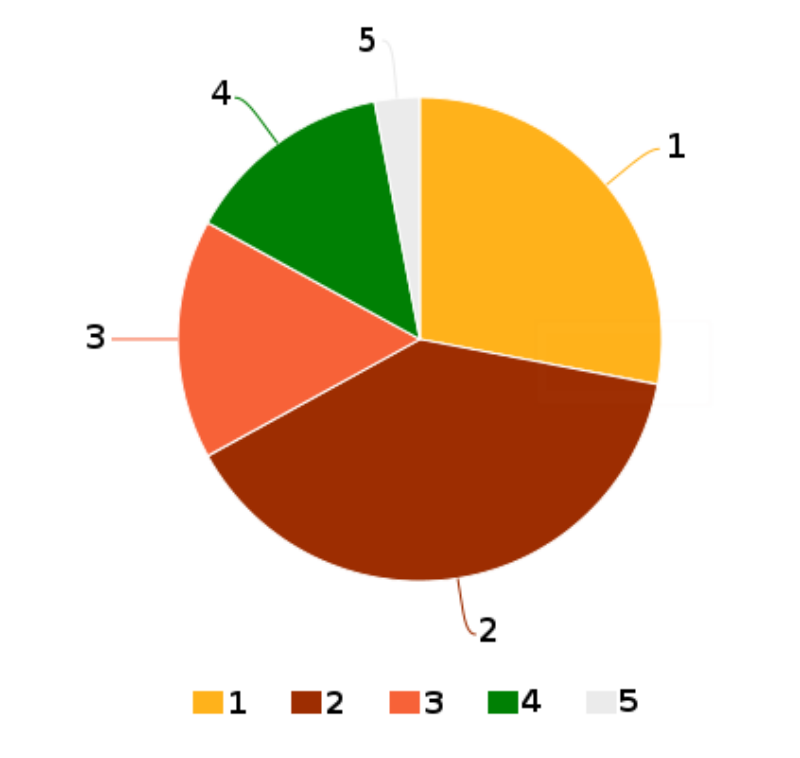
The following lists the names of the numbered foods shown and the percentages of the individual foods
1: grains & below ground vegetables (rootcrops, ...): 28%
2: above-ground vegetables & fruit: 39%
3: soy-derivates, animal muscle, beans, nuts, eggs: 16%
4: dairy products, seaweed and certain vegetables like kale, broccoli, beans, ...: 14%
5: oils: 3%
Note that the percentages are only indicative; the idea here is that people would generally grow the food themselves (in permaculture zone 1 and 2) and harvest it depending on the current availability. Since you may have crops that failed, may had too much planted of one particular crop, or simply did not foresee that some were to be ready sooner or later, you would generally adapt on this (and so not follow the amounts listed above exactly). The idea is simply to follow it "more or less" and make sure you consume a variety of differend crops so you can be certain to have all nutients consumed in large enough quantities.
Log into OpenClipart
- Tags
- chart food pyramid nutrition pie chart shojin ryori
- Safe for Work?
- Yes
0 Comments. Please login to comment or add your own remix.